Optimum Inventory Levels

In this article we’ll talk about the fact that there exists for every inventory situation a theoretical optimum inventory level. We’ll provide the knowledge you need to determine that level across your managed inventory.
This is the average inventory needed to provide a given fill rate without the added problems created by:
- • Economic order quantity considerations
- • Minimum pallet or carton quantities
- • Larger than needed purchases to take advantage of discounts
- • Other “real-world” issues that interfere with optimizing inventory turns
This theoretical optimum quantity is, however, driven by a series of elements that are fundamental and unique to each and every SKU in the inventory. They are:
- • The historical pattern of demand for the item, which in turn determines the forecast for the item and the mean average deviation (which is the measurement of the inherent variability of the item).
- • The lead time and order frequency associated with the routine reordering of the item.
It would be handy to be able to determine this quantity, either for a given item, or for an entire group of items. It would provide a base point against which to measure our actual inventory.
Unfortunately determining the Theoretical Optimum Inventory (TOI) is not a simple or direct process. (Least you despair when reading the next few paragraphs, before we are through we will reduce the problem to a simple process.)
Determining the TOI is not a simple function of the forecast or even the reorder target or reorder point. In fact, you can have two items with the identical reorder targets and yet have radically different TOI’s. This situation is due to the fact that the relationship of the lead-time to the order frequency is critical. It so happens that the reorder target is determined by the sum of the two times regardless of which is greater. As the inventory replenishment process takes place, however, the relationship of the two items has a big influence. Shorter order frequencies play a major roll in lowering the TOI. For example, you could have two items with identical forecasts and MAD’s, one with a lead-time of one week and an order frequency of every three weeks, and another item with the reverse. Both will have the same reorder target, but the one with the one-week order frequency will have a significantly lower TOI than the other.
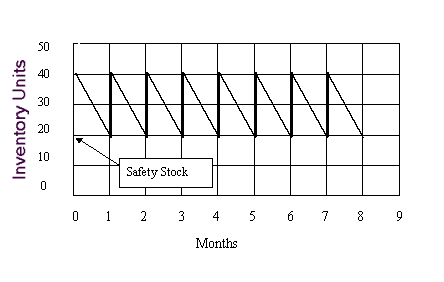
The process to determine the TOI is to plot out the classical “saw tooth” graphs that result from simulating the reordering process. We provide a series of examples of this process in my book “A New Era In Inventory Planning” on page 66. In general the process is similar to the graph shown in Exhibit A below. The vertical axis is the amount of inventory that is on hand at any point in time, and the horizontal axis is the passage of time.
Exhibit A

The interpretation of this saw tooth graph is that the inventory starts to decease with time as the product is sold. At some point (determined by the order frequency) a reorder is triggered (that is the difference between the reorder target and the net available on hand). Then, after the lead-time has passed, the product arrives and is put in stock. The saw tooth rises up to the peak only to start down again. If you plot these graphs for any variety of items, as we do in my book on page 66, the process will always come back to the characteristic saw tooth shown below.
The quantity that is never penetrated by the saw tooth is the safety stock. In the real world the safety stock will be penetrated whenever the demand for the item exceeds the forecast (that is what the safety stock is for). Conversely, there will be an equal number of times that the saw tooth does not get down to the safety stock because the demand was less than the forecast. Consequently on the average the safety stock will be a layer of inventory that on the average will always be part of the TOI.
The other part of the TOI is the average of the height of the saw tooth. In other words, the TOI will be made up of the safety stock plus half the height of the saw tooth. This assertion is based on the fact that on the average half of the saw tooth quantity of stock will be around at any time. At times there will be the full amount of the height, and other times it will be right at the bottom, but on the average it will be half the amount. In our example above the safety stock is 20 units, and half of the saw tooth is 10 units, making the TOI 30 for that particular SKU.
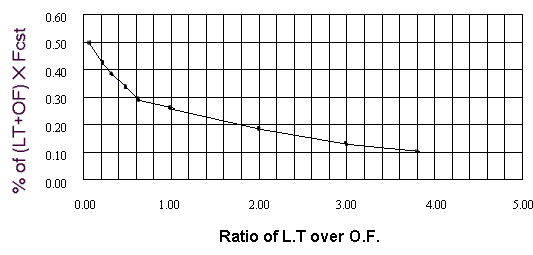
By plotting out the TOI for innumerable SKU’s we were able to develop a general relationship that appears to be universal. It relates the ratio of the lead-time (LT) of the item over the order frequency (OF), to the percent of the “base quantity” portion of the reorder target calculation. (The base quantity is the first part of the reorder target equation, and is simply the forecast times the sum of the lead time and order frequency in months.) This relationship is displayed in Exhibit B.
Exhibit B

Optimum Inventory
By plotting out the TOI for innumerable SKU’s we are able to develop a general relationship that appears to be universal. Having developed a universal formula we are able to have MARS perform the necessary calculations to come up with the TOI for any group of inventory items. Before we proceed, however, there are two points worth noting:
This entire discussion assumes that the inventories are being routinely reordered using the methodology of our Mars Inventory Workstation or a comparable sophisticated reorder target concept. Simplistic systems or manual estimation of reorders is not going to approach the efficiencies of the figures being displayed. Note how the amount of inventory needed drops when the order frequency is small (and hence the ratio becomes large). Conversely note how the amount of inventory needed rises dramatically when the order frequency is large compare to the lead-time. This once again, reiterates the point that order frequency is one of the most important factors in improving inventory efficiency. We ran these calculations for a series of items of various characteristics. The results are tabulated below:
| Item Number | Forecast | Lead Time | Order Freq. | MAD | LT/OF | S.S. | Base | Opt. Inv. | Turns |
|---|---|---|---|---|---|---|---|---|---|
| Test 1 | 40 | 14 | 7 | 21 | 2 | 12.3 | 27.5 | 17 | 28.3 |
| Test 1a | 40 | 7 | 14 | 21 | 0.5 | 12.3 | 27.5 | 21.4 | 22.5 |
| Test 2 | 10 | 14 | 14 | 8 | 1 | 5.7 | 9.2 | 8 | 15 |
| Test 2a | 10 | 14 | 7 | 8 | 2 | 4.7 | 6.9 | 5.9 | 20.5 |
| Test 3 | 500 | 14 | 7 | 52 | 2 | 30.4 | 344.3 | 89 | 67.4 |
| Test 4 | 4 | 14 | 28 | 5 | 0.5 | 4.9 | 5.5 | 6.7 | 7.2 |
| Test 5 | 1319 | 30 | 15 | 441 | 2 | 452.3 | 1946.1 | 783.2 | 20.2 |
| Test 6 | 68 | 20 | 30 | 45 | 0.7 | 50.3 | 111.5 | 94.9 | 8.6 |
| Total | 1991 | ||||||||
| Weighted Ave. Turns | 31.8 | ||||||||
The various examples above offer some interesting insights to inventory performance. Note the following:
Items “Test 1 and 1a” – In these two examples everything is identical except that the lead time and order frequency are reversed. Note that the turns are improved by 20% when the order frequency is the lower figure.
Items test 2 and 2a – In this case the order frequency is taken down to one week vs. two and there is a 37% improvement in performance.
Item test 3 – This is a fast moving item with fairly low variability (MAD is only 52 or about 10% of the forecast) and can be ordered weekly. Theoretically you could see over 60 turns under these ideal conditions!
One key point comes across in the overall picture. The number of turns is higher than any of us can even imagine achieving. Remember however, we have not considered many of the elements that drive inventory levels up such as EOQ, minimum purchase quantities, discounts, etc. we would estimate subjectively that these other considerations would in an average situation cut the turns in half from the TOI levels. Even cut in half we are looking at very attractive performance levels, and again, far from what we normally expect to achieve.
These tempered levels are achievable in my opinion. The elements that prevent us from hitting these kinds of performance levels are:
- • Dead stock that has accumulated and no action is being taken.
- • Arbitrary overrides by sales and marketing based on faulty expectations.
- • Promotion stock-ups that fail to achieve their sales objectives.
- • Failure to consistently use the quantitative system to drive the inventory replenishments.
Mars Inventory Workstation allows you to perform the analysis that we have just outlined in a very simple and efficient manner. You need only to call up the “Theoretical Optimum Inventory” feature that in turn brings up the pre-select screen. This screen gives you the option to select vendors, locations or all of the company. Upon hitting the calculate button, the system, in less than a minute, performs all the calculations and presents the results, both in total, and subtotaled by vendor and location.
To learn more about how Mars can help, see our offer below.