The Relationship of Fill Rates to Inventory Levels in Inventory Replenishment Forecasting
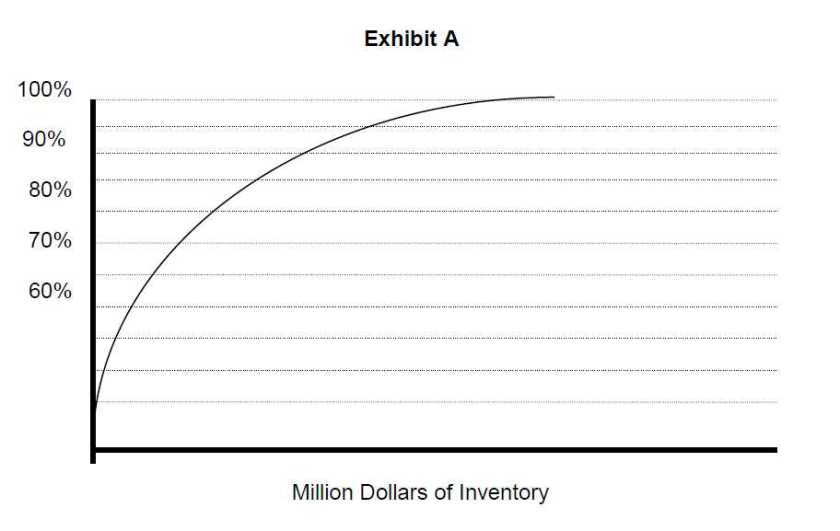
There is a very definite relationship of fill rates to the amount of inventory being stocked. Generally, as more and more inventory is added, the fill rates of customer orders will increase, but at an ever decreasing rate (e.g., as you get closer to the theoretically impossible 100%, fill rate improvement is harder and harder to come by for the same increment of added inventory). Exhibit A below illustrates this relationship graphically. There are no quantities on the X axis, since there are many other factors, unique to each specific company, that drive the exact shape of the curve, but the general concept is valid across the board.
While the fundamental shape of the curve in exhibit A is universally valid, there are a number of factors that determine how that curve will apply to a given company. These are:
- The breadth of the product line that is being stocked.
- Vendor characteristics (e.g., vendor reliability, lead times, and order frequency).
- The efficiency of the software that is driving the inventory stocking rules.
- Breadth of Product Line Being Stocked
The typical distributor will stock only a certain percent of the total items that are available from their array of vendors. It may be a very high percent, or much lower percent, depending on the breadth of the vendors’ offerings, and the nature of the business (e.g., a distributor who stocks repair parts that are all “mission critical”, will stock a much wider line of items than a consumer product company where there is a certain tolerance for the seldom used product being special ordered on the factory — we’ll be publishing another article on this soon)
As the authorized stock list is broadened, it will incorporate more and more slow moving items. These items inherently have a high variability of demand relative to their forecast, and therefore need greater safety stock, and hence more inventory to achieve the same fill rate.
Vendor Characteristics
The reliability of vendor deliveries coupled with the average time to receive product, and finally, the frequency with which you can reorder all have a strong influence on the efficiency of the fill rate curve. Interestingly, the average lead time for the vendor is the least critical item, provided that it is consistent.
Deliveries that arrive randomly are deadly to the effective management of an inventory. Reliability of fill is obviously an issue as well. In a sense, bad fill rate by the vendor is just another form of random lead times, since the product arrives eventually, but not when the system anticipated it.
The frequency with which you can order is also a highly critical item. Frequent reordering makes a fantastic difference in inventory efficiency. Therefore when a vendor sets high minimum total order quantities, or high minimum individual item quantities, he is severely impairing your inventory function. This is also true of pallet quantities or lot size restrictions.
Software Efficiency
Once you recognize the characteristics of the vendors you have, and decide the breadth of the product line that you are going to stock, then the efficiency of the software that drives the reordering process enters the picture. The inventory management software should encompass all the factors mentioned above, and hopefully create a replenishment order that is the optimum under the situation that exists. Unfortunately, most systems in use today, and for that matter, being offered in commercial packages, fall far short of this objective. Simplistic forecasting techniques, and reorder point determination further add to the dilemma of achieving high fill rates with the minimum inventory investment.
Let’s now assume that the curve shown on Exhibit A is for a specific company and recognizes all the factors discussed up to this point. Depending on the software being used we can get a series of curves that look like those in exhibit B.
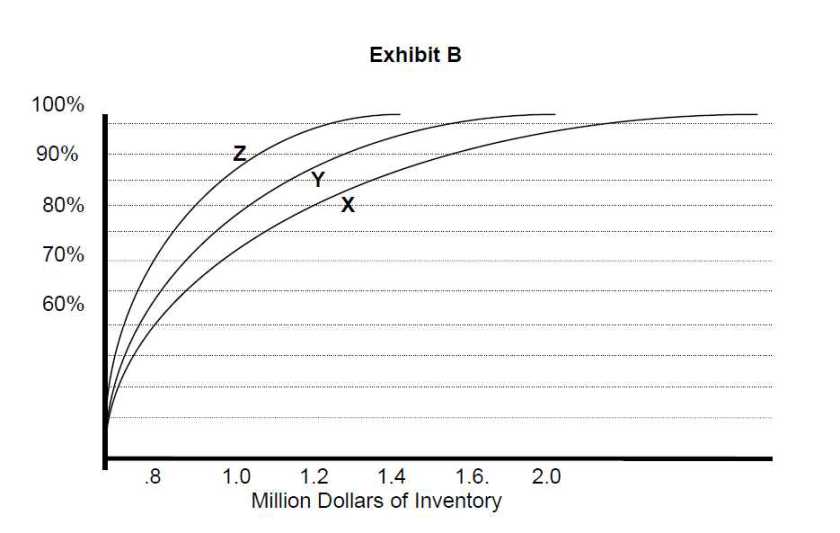
The curve marked Z depicts the most efficient system, since it provides the highest fill rate for the same inventory. Note how the fill rate increases dramatically for every unit of inventory added. The system is very efficiently using the inventory despite the various other factors that it must contend with, such as lead times, and order frequency. Note also, however, that even this efficient system must adhere to the fundamental forces that cause the curve to flatten out as we try to hit higher and higher fill rates.
Curve Y is a less efficient system, since it makes poorer use of the added inventory, and curve X is worse yet. Note that if we want to hit about 95% efficiency for our theoretical company, the amount of inventory required goes from about $1.2 million on curve X, to $1.4 on curve Y, and $2.0 on curve Z. This increased inventory then translates into significantly poorer turns. In fact, in our example, comparing curve Z with X, there is a 67% required increase in inventory to achieve the same fill rate. Translating this into 14 turns, it means that if a company was living with a system that resulted in the X curve, and was getting 5.0 turns, they would an enjoy an improvement to 8.3 turns with the more effective software system.
MARS) Inventory Replenishment and Forecasting spoftware from NBDS is a system that meets the requirements stated above. The forecasting system and reorder point logic is crafted to optimize your inventory performance. It accepts the conditions that you must live with regarding vendor performance and market pressures, and then handles these factors to bring in the right quantity at the right time. The plethora of other features also allows you to cope with all the other constrains that arise on a day-to-day basis in managing your supply chain.
Learn more at www.nbds.com.
To learn more about how Mars can help, see our offer below.